What has changed in CPU cores in M3 chips?

If you read the initial reviews of Apple’s new M3-based Macs, you’d be forgiven for thinking little had changed in their CPU cores, apart from a rejigging of numbers and an increase in the maximum frequency of their P cores. As my MacBook Pro 16-inch M3 Pro arrived three days early, this article presents a tentative first look at what has changed in their CPU cores, and from that, how you might choose the right chip for your next Apple silicon Mac. Like Apple, I’m going to make comparison between M1 and M3 chips, as in most respects discussed here, M2 CPU cores didn’t change as much from those in the M1, and I’ve had and tested four different M1 models.
Cluster size
The most obvious difference between M1/M2 CPU cores and those in M3 chips is in the size of their clusters. In M1 and M2 chips, CPU cores are grouped into clusters of 2 or 4, within which cores share L2 cache and run at the same frequency. In M3 chips (certainly the M3 Pro, and I understand the M3 Max as well) clusters are composed of 4 (M3 basic) or 6 (Pro and Max).
This change has impact on chip selection.
macOS tries to allocate threads running at higher priorities, as set by their Quality of Service (QoS), to P cores whenever possible. This is what we want, as it ensures that the apps we’re running deliver best performance, albeit at higher power consumption. When the P cores are already fairly fully occupied, macOS may instead run high QoS threads on the E cores. While it has compensatory mechanisms for doing this (see below), it may mean that those threads run more slowly than we’d want.
If you already have an Apple silicon Mac and are wondering whether to upgrade to an M3 model, then you can use this as a way of working out which chip you’ll need. Load your current Mac up with the apps you normally use together when working, and watch their use in Activity Monitor’s CPU History window. If its P cores are fully occupied much of the time, and that workload often spills over to the E cores, then you should aim for an M3 with more P cores; if there’s always adequate spare capacity on the Mac’s P cores, then you probably wouldn’t get much added value from an M3 with more P cores.
This changed cluster size in M3 chips is significant, as it could not only have effects on performance, but also on power use. When running at full pelt, all six P cores in an M3 Pro cluster can use as much as 5.5 W, while six in an M1 Pro will use about 5.8 W.
E cores
From my preliminary measurements, E cores in an M3 Pro differ little from those in an M1 Pro, except for their frequency management, which is determined by macOS. M1 E cores have a maximum frequency of 2064 MHz, while those in M3 chips reach 2748 MHz. But, when running low QoS threads in the M1 Pro chip, E core frequency is set to 972 MHz, and that in the M3 Pro is 744 MHz, giving a ratio of 1.3 for M1/M3. Integer, floating point, NEON and Accelerate performance at those frequencies matches the difference in frequency, at 1.3-1.4. That means the M3’s E cores run background threads slightly more slowly than the M1 because macOS sets their frequency lower.
That isn’t true, though, when the E cores are being used to run high QoS threads that couldn’t be accommodated on P cores. Those are run at maximum frequency, which favours the M3 Pro by a factor of 1.3.
Replacing an M1 Pro with an M3 Pro thus slows background tasks, but accelerates high QoS tasks that have overflowed onto the E cores.
P cores
There are greater differences between the P cores in an M1 Pro and those in an M3 Pro. M1 P cores have a maximum frequency of 3228 MHz, while M3 P cores run up to a maximum of 4056 MHz, a ratio of 1.26 in favour of the M3. A similar ratio is seen for integer and floating point performance, at 1.30 and 1.28 respectively, but vector performance using NEON or Apple’s Accelerate library is faster still on the M3 Pro P core, at ratios of 1.67 and 1.63.
This suggests that improved integer and floating point performance is largely (if not completely) the result of increased core frequency, but that there are likely to be further improvements in vector processing. Perhaps Apple has improved the design of the NEON unit in M3 P cores.
P v E
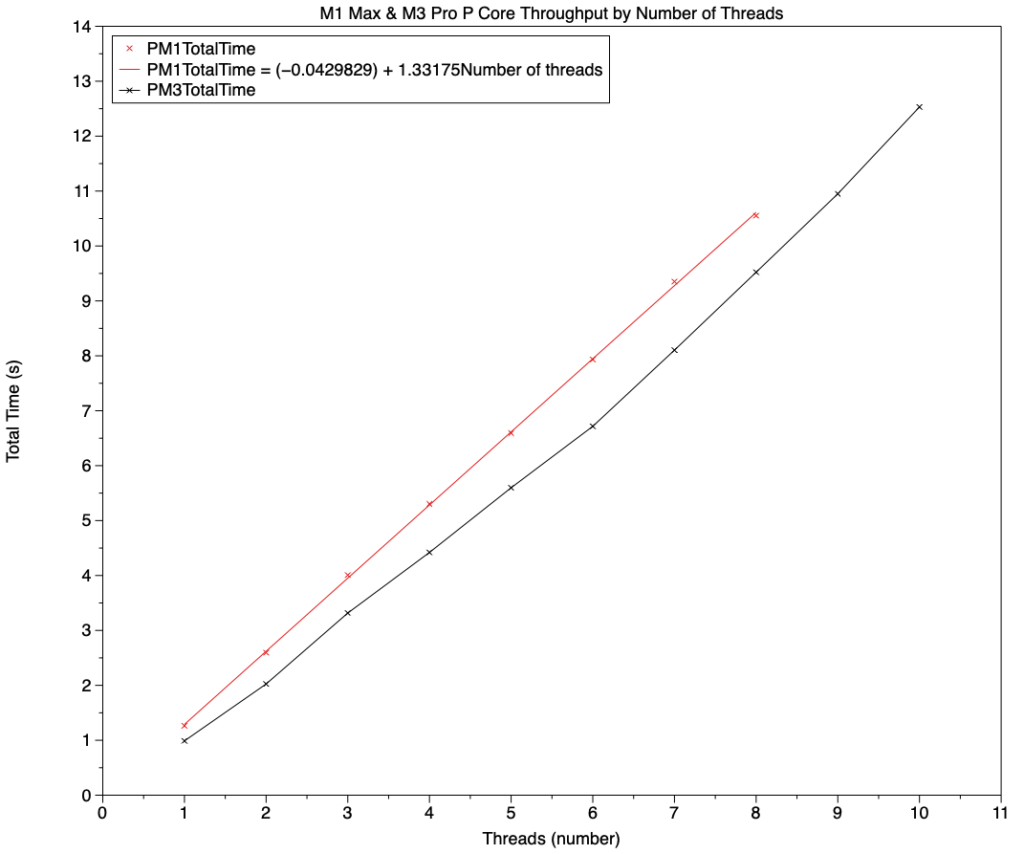
Aside from any improvement in vector processing in M3 P cores, M1 and M3 cores show different patterns of performance under load. These are perhaps clearest in the two charts below. Loads were applied using AsmAttic, which here runs tight loops of floating point arithmetic that remains in-core, accessing only registers and not memory. These charts show the time taken to complete one or more threads, each running 200 million loops of assembly code. Each thread is run as if on a single core at 100% active residency, i.e. it’s one core’s worth of performance, so 6 threads will fully load a 6-core P cluster.
This chart shows the total time to complete running all the threads, by the number of threads (effectively the number of cores), for an M1 Pro in red, and an M3 Pro in black. These threads were all run at maximum QoS (33), so were run preferentially on P cores. Those run on the 8 P cores in an M1 Pro (red) show a near-perfect linear relationship, with each thread fully occupying one core for a period of 1.3 seconds.
The lower black line shows equivalent results for the 6 P and 6 E cores in an M3 Pro. For 1-6 threads, these were all run on its P cores, then on an increasing number of its E cores as well. That is quite linear up to 6 threads, where the time taken is significantly less than that of the M1 Pro. By 6 threads, that difference is over 1 second; in the time the M1 Pro took to run 5 threads, the M3 Pro had almost completed 6.
From 6-8 threads, the two lines run in parallel, indicating that the M3 E cores were delivering similar performance to the P cores in the M1 Pro. You wouldn’t want to run more than 8 threads, though, on the 8P + 2E cores of the M1 Pro, as they would risk displacing background threads on the two E cores. On the M3 Pro, you can go safely up to a total of 10 threads, on 6 P and 4 E cores, without compromising background threads. Indeed, because the E cluster is running at maximum frequency, background tasks might even complete more quickly under that load.
Differences are reversed when running low QoS threads on the E cores, as shown here, again with the 2 E cores of the M1 Pro in red, and the 6 E cores of the M3 Pro in black.
The frequency of the M1 Pro E cores is increased when they’re running a second thread, which accounts for the small change in total time from 1-2 threads. However, with more than 2 threads, further threads are queued, and performance suffers as a result. The 6 E cores of the M3 Pro have three times the capacity for background threads, and although running them more slowly, they cope with up to 6 threads, beyond which those threads are queued, and the time required to complete them rises more rapidly.
CPU History
The most accessible window you have on core load and performance is CPU History in Activity Monitor. Although it can cast light on the use of different types of core, and help you decide whether your next Mac needs more cores, it’s also seriously misleading, as shown in the screenshot below.
This shows what happened during two tests using my app AsmAttic: in the first, responsible for the large blocks of green in the E cores, I ran a load of 6 threads at low QoS; in the second, reflected in the much narrower blocks for the P cores below, I ran the same load of 6 threads on the P cores. When the E cores were fully loaded, their frequency was 744 MHz, that’s only a little above their idle, but when the P cores were fully loaded, they were running at close to their maximum at just under 4000 MHz. This persistent failure in Activity Monitor to take core frequency into account gives seriously misleading impressions.
Summary
There’s much more to comparing CPU cores than multi-core benchmarks.
If you already have an Apple silicon Mac, observe patterns of use of P and E cores during normal use to determine whether you need a Mac with more cores.
CPU core cluster size has changed in M3 chips, from 2-4 to 4-6, which is likely to have extensive effects on performance and power use.
M3 E cores appear similar to those in the M1, but have a higher maximum frequency, and are run at lower frequency for background tasks.
M3 P cores appear to have improved performance in the vector (NEON) unit, and have a higher maximum frequency.
Increased E core count increases the capacity to accommodate overflow of high QoS threads from P cores.
macOS core management has also changed.
I will post further analyses of the M3 Pro chip’s CPU performance as I assess the data.


