How to discover what Apple silicon CPU cores are doing
One of the most fascinating questions about Apple silicon Macs is how code is allocated to their CPU cores to make best use of their processing power while remaining energy-efficient. For the last three years I’ve been researching this on a range of chips from the basic M1 to an M3 Pro, in a wide range of circumstances. This article considers which tools you can use to discover what’s going on with CPU cores, without having to write advanced code in C, C++ or assembly.
To be useful for this purpose, measurements should include:
Core frequency. As this is controlled by macOS for each cluster, frequencies of all cores within any given cluster are the same, even though some may not be actively processing instructions.
Active residency. This is the percentage of time that core isn’t idle, but is actively processing instructions.
CPU power, an estimate of the average total power used by all the CPU cores together.
Tools considered here are:
Activity Monitor’s CPU History window
Xcode Instruments’ CPU Usage tool
powermetrics (command tool)
CPU core loading benchmarks.
Activity Monitor
When run on an Apple silicon Mac, its CPU History window provides an accessible indication of individual core activity as notional CPU %. For quick checks, this is helpful, but it has several serious flaws that make it unsuitable for quantitative studies.
Here are two examples taken from a series of compression tests in which the app used (Cormorant) could compress a standard 10 GB file using different numbers of threads at different levels of Quality of Service (QoS). When there was little other activity on the M1 Max, a series of 5-10 threads at a high QoS of 33 show increasing core recruitment spilling over from P to E cores.
A series run at a low QoS of 9 shows all activity is confined to the two E cores at the top.
Problems in using CPU History include:
CPU % correlates roughly with core active residency, but doesn’t take frequency into account. This can lead to gross errors, particularly with E cores, which can run with an active residency of 100% but at little more than idle frequency;
infrequent sampling, losing most detail;
no numeric values at all.
Xcode Instruments
These provide a rich and powerful suite of tools intended for use when developing and debugging code in Xcode. Among these is CPU Usage, which addresses some of the shortcomings of Activity Monitor. These tools generally work best when used with debug builds of Xcode projects, as shown in the next two charts.
This shows results from a test run in debug mode. Four asynchronous tasks are each run within the app’s main thread, where they fully load a single core. That thread is relocated from CPU 7 to CPU 9, back to CPU 7, briefly to CPU 8, back to CPU 7, and finally on CPU 8 again. Frequent relocation between cores like this is commonly seen in Instruments when running apps in debug mode.
This chart shows a similar test, this time using Dispatch to run four separate threads on individual cores, at high QoS and in debug mode.
In addition to frequent relocation of threads between cores, the CPU Usage tool results in noisy records where much of the activity is the result of the measurement tool and related processes. Those can be greatly reduced when running release builds of the app, but those lack the detailed information about active tasks.
A release build of the same code used in the upper of the two previous charts shows no relocation of its main thread during testing, and there’s also little background noise from other threads.
Instruments is a superb collection of powerful tools, but not really suitable for research into CPU cores, as:
although their CPU % does take core frequency into account, neither frequency nor active residency values are available;
it doesn’t appear possible to extract numeric data for further analysis;
Instruments itself imposes significant CPU load, and may change core management.
powermetrics
My preferred tool for obtaining quantitative data is the command tool powermetrics. This has to be run with elevated privileges, using sudo, and has many options that are detailed in its man page. As an example,
sudo powermetrics -i 100 -o filename.txt -n 10 -s cpu_power
sets the tool to collect samples of 100 ms duration, to write its results to the file filename.txt, to collect a total of 10 samples, and only to gather and write data for its cpu_power profile.
The resulting text file contains copious detail, most of which appears reliable and representative. There is an option to generate a property list instead, but that’s so verbose that I have avoided trying to parse it to extract its contents. This makes data extraction and analysis laborious, but the quality of data appears consistently high.
This chart shows cluster frequencies for the three clusters in an M1 Max. A test load was applied just after 1 second, and was completed at about 4 seconds, matching the reported elapsed time of about 3.2 seconds. P0 frequency (solid line) rose rapidly to just over 3,000 MHz, and was sustained at that until completion. The other P cluster (P1) was run much of that time at its idle of 600 MHz, with short peaks up to 2,500 MHz. The E cluster was run throughout at about 1,000 MHz, with fewer and smaller peaks.
Here, to enable easier comparison, cluster active residency is shown with a scale maximum of 100% for each of the three clusters. The effect of the load on P0 active residency (solid line) dominates much as it did for frequency, but there are also many smaller and briefer peaks. To unravel what those represent, you need to analyse individual core responses, something only possible using powermetrics.
This bar chart shows just the test period, here as sample number rather than time (each sample representing approximately 0.1 second). Active residency for the first core, P2, is shown in red, P3 in orange, P4 in blue, and P5 in purple. The bulk of the test thread was run on P2 to begin with, swapped over to P4, then brought back to P2 to complete. There are, though, significant contributions made by P3 as well.
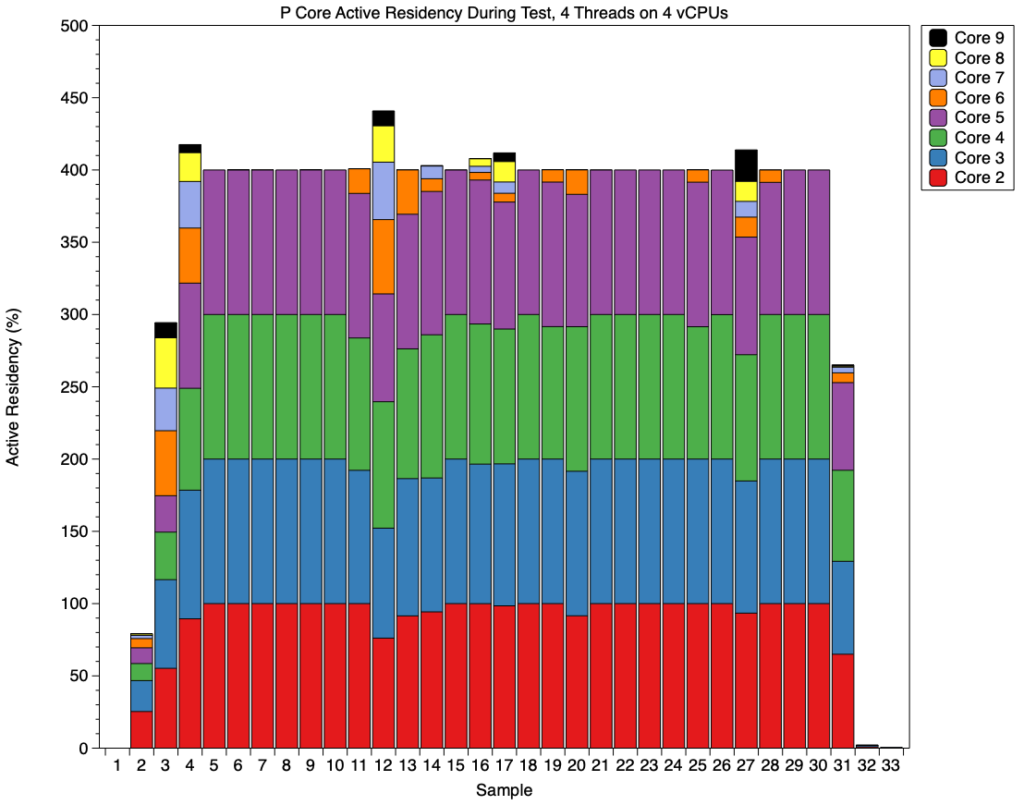
It’s only when you look at active residency across all P cores that the picture becomes clear: when the second P cluster is active, it appears to be handling some of the test load. This shows active residency for all eight P cores, when running 4 threads on 4 virtual cores. To maintain the 400% required to complete the threads on time, there are several sample periods in which P6 and P7 take significant load, for example in samples 12 and 27, about 1 and 2.5 seconds into the test.
CPU core load
In addition to tools to measure what is happening in the CPU cores, you need some means of creating threads that will make those cores busy. The ideal here is code that can be run in a controlled number of threads, and at a set Quality of Service (QoS). While you can make interesting observations using standard benchmarks like Geekbench, that gives you no control over the number of threads, or the QoS they will be run at.
I’ve provided guidance on how to do this using my own test app AsmAttic, available in source from here. Alternatively you can create your own in any language that gives you access to multithreading using Dispatch (formerly Grand Central Dispatch), and my compressor-decompressor utility Cormorant has the controls required.
Obtaining accurate times to run code that loads CPU cores is another important measurement in itself.
Summary
Activity Monitor’s CPU History window is easy to use, but has serious flaws, including omission of core frequency, that can make it misleading. However, it can be good enough for quick checks.
Xcode Instruments’ CPU Usage isn’t intended for this purpose, although its charts are a big improvement on Activity Monitor. Running tests in debug mode can alter behaviour, and Instruments itself imposes a significant load.
powermetrics is reliable, accurate and imposes minimal load. However, extracting data from its reports is laborious.
Load the cores using an app that gives you control over the number of threads used and their QoS, as well as accurate measurements of time taken.