Why % CPU in Activity Monitor isn’t what you think

One of the most frequently quoted measurements in Activity Monitor is % CPU. When the fans blow, or a Mac becomes sluggish, it’s often the first figure to look at and wonder why that process is pulling over 100%. That’s the first thing you learn: here, per cent doesn’t mean out of 100, but the sum of the real percentage for each core. As this Mac has eight cores, that allows it up to 800%, until you realise that Intel processors can use Hyper-Threading to pretend that each is two cores, making a maximum of 1,600%, not bad for a single processor. Then you come completely unstuck with Apple silicon.
Apple defines % CPU as “the percentage of CPU capability that’s being used”, a phrase that doesn’t appear to have any definition either in Apple’s documentation or elsewhere. So like everyone else, you assume that 100% for a core represents its maximum processing capacity. Only you couldn’t be more incorrect: in truth, the number given as % CPU is nothing like that.
Tests
To examine this more clearly, I have an app that runs tight loops of assembly code to load CPU cores on Apple silicon chips and measure their performance. For this, I got it to run several threads, each consisting of 500 million loops of floating point calculations. By running those at different Quality of Service (QoS) settings, macOS will send them to different core types.
When I run two threads at low QoS so they’re run only on E cores of a MacBook Pro M3 Pro, each takes 10.2 seconds to complete. If I instead run eight threads at high QoS, the first six of those will be run on the P cores, but the remaining two spill over onto two of the E cores, where they complete in just 3.0 seconds each.
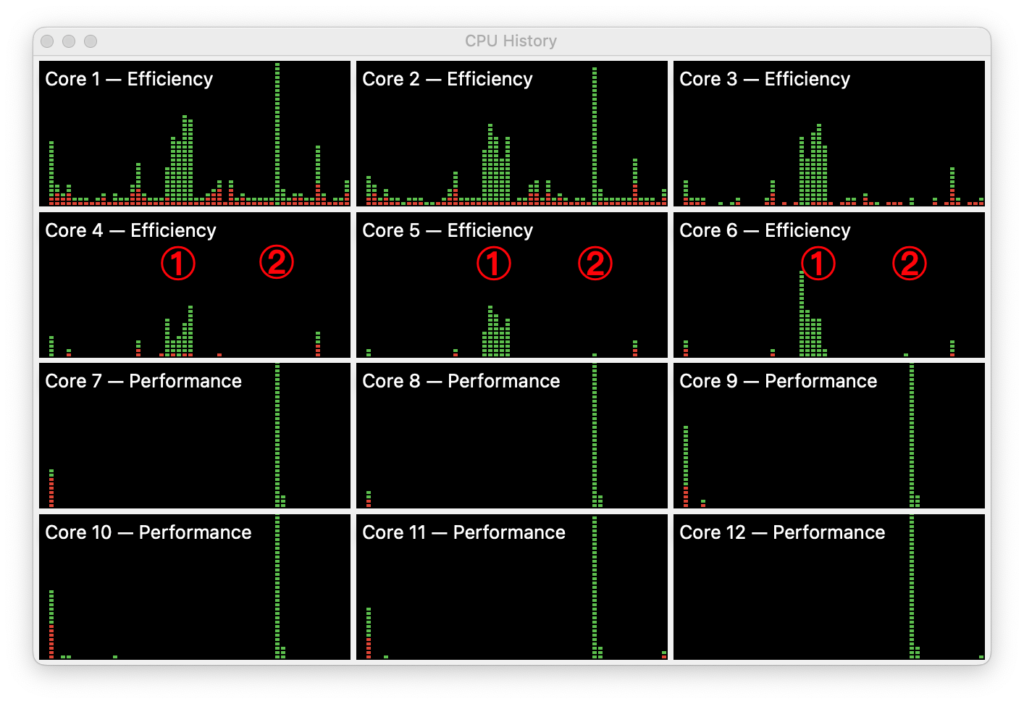
Yet, according to % CPU in Activity Monitor, the two threads on the E cores come to 200%, and the two from eight run in the second test also come to 200%. You can see this in the CPU History window.
Here are the 6 E cores at the top, and 6 P cores below. ① marks the first test on two E cores, and shows the total of 200% spread across all six E cores over the 10.2 seconds it took to complete. ② marks the second test, with all 6 P cores and two E cores hitting 100% each, for a total of 800%, as shown in Activity Monitor’s window.
By now I’m sure you guessing how running the same code on the E cores could vary in speed by a factor of 3.4 (10.2 against 3.0 seconds) although they’re the same % CPU: that measurement doesn’t take into account core frequency.
Frequency
Unlike traditional Intel CPUs, CPU cores in Apple silicon chips can be run at a wide range of frequencies, as set by macOS. To make this frequency control a bit simpler, cores are grouped into clusters, that also share L2 cache, and within each cluster all cores run at the same frequency. The M3 Pro chip consists of two clusters, one of 6 E cores, the other of 6 P cores.
When macOS loads two of those E cores with low QoS threads, it sets them to run at a low frequency to make the most of their energy efficiency. When it loads two E cores with threads that were intended to be run on P cores, as they have a high QoS, it runs the E cluster up to high frequency, so they perform better.
Measuring frequency of CPU cores is straightforward using the powermetrics command tool. When those threads were being run on E cores at low QoS, frequency was held at their minimum of 744 MHz, but run at high QoS their frequency was set to maximum, at 2748 MHz, 3.7 times faster. If full load at maximum frequency is 100% of their capability, then at low QoS they were really running at 27%, not the 100% given by Activity Monitor, and that largely accounts for the difference in time that those threads took to complete their floating point calculations.
What is % CPU?
What Activity Monitor actually shows as % CPU or “percentage of CPU capability that’s being used” is what’s better known as active residency of each core, that’s the percentage of processor cycles that aren’t idle, but actively processing threads owned by a given process. But it doesn’t take into account the frequency or clock speed of the core at that time, nor the difference in core throughput between P and E cores.
The next time that you open Activity Monitor on an Apple silicon Mac, to look at % CPU figures, bear in mind that while those numbers aren’t completely meaningless, they don’t mean what you might think, and what’s shown as 100% could be anything between 27-100%.


