Last Week on My Mac: Gone to launch
I looked in the macOS cupboard last week and opened yet another can of worms, in those Macs that take many seconds or even minutes to launch some apps. In common with many other thorny problems, there’s little consensus about many of the details, other than this mostly affecting Intel Macs running macOS Big Sur or later, although I have seen reports of similar problems in M1 Macs.
Although some have apparently found solutions, such as Jeff Johnson’s recommendation to disable SIP, the only consistent answer appears to be moving the app to another location and moving it back again. Even that’s only a temporary measure, and sooner or later those apps will launch slowly again.
Last week I thought I might have a chance to get to the bottom of the problem, when Kristian kindly sent me some log extracts from his Mac’s slow launches, and patterns started to emerge. But like every other good can of worms, the deeper I dig into the can, the more worms there are. This article is a convenient opportunity to reveal some of those.
What takes time?
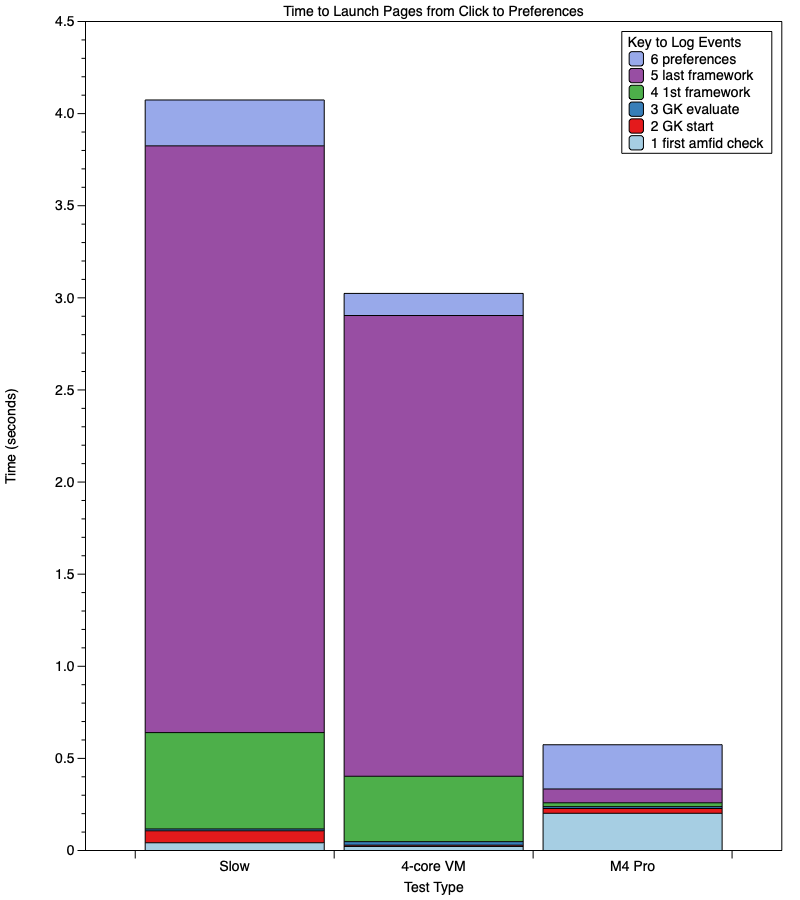
Looking at three test launches of Pages, greatest differences were seen in the time taken to check the many frameworks in the app bundle, shown in purple in the bar chart below.
In the slow launch provided by Kristian, total time was just over 4 seconds, within which checking frameworks took 3.2 seconds, 80% of launch time. A similarly slow launch in my test VM took just over 3 seconds, with 2.5 seconds on frameworks, while a fast launch completed in just over half a second, with less than 0.1 seconds spent in framework checks.
Cache misses and SIP
What I didn’t mention in those log extracts was the role of cache misses in framework checks in the slower launches. At that stage, it looked as if differences were down to whether each framework had to be checked from scratch as its previous assessment couldn’t be found in cached security checks.
I have therefore repeated the VM tests in two further conditions, with SIP disabled, and with Gatekeeper/XProtect checks disabled.
When launched after a restart, with SIP fully disabled, Pages did indeed launch quickly, in a total time of 0.34 seconds with less than 0.05 seconds checking frameworks. However, disabling Gatekeeper resulted in a total launch time that was only slightly quicker than normal at 2.4 seconds, and 1.8 seconds checking frameworks.
Behaviour with SIP turned off was odd, in that no Gatekeeper process assessment was recorded, and there was no mention of any cache misses for framework checks. In contrast, when Gatekeeper was turned off, there was a Gatekeeper process assessment using a previous code evaluation, and cache misses were recorded for all the frameworks checked. My previous experience with disabling Gatekeeper is that its checks still take place and are logged normally, but their results are ignored, so that wasn’t as paradoxical as it might appear.
Calibre
Pages is an atypical example, being an App Store app signed by Apple, so I then turned to the other log record provided by Kristian, from Calibre. This is remarkable for having 68 frameworks, and took a total of 4.6 seconds to launch on his Mac, with nearly 4.4 seconds of that spent checking those frameworks, all of which were cache misses and reported with constraint violations by amfid.
When I tried repeating this in my test VM and with SIP or Gatekeeper disabled, results became far more complicated, so I have summarised them in a table.
Rows in this table record results from each of six launches of the current release of Calibre. The first is that obtained by Kristian on his Mac, the remainder are all obtained from a 4-core VM running macOS 14.7.5 on a Mac mini M4 Pro. Those were:
first run after installation, with the quarantine flag set;
second run a minute or so after that first run, without a restart;
third run after closing the VM and starting it up again;
after downgrading security to permissive by disabling SIP completely;
after disabling Gatekeeper/XProtect checks, but still at Full Security, with SIP enabled.
Total launch time is measured from the initial click in the Finder to the app loading its preferences. Time checking frameworks is measured from the start of the first check called by amfid on one of Calibre’s frameworks, to the completion of the its check on the last framework. XProtect scan is measured between the announcement of the start of Gatekeeper’s XProtect scan, and its completion.
The fastest launch by far was in the second run, when none of the checks were performed, there were hardly any log entries from security subsystems or processes, and it completed in 0.158 seconds. The slowest was the first run, when the XProtect scan took over 6 seconds, and accounted for 77% of the total launch time of almost 8 seconds.
Remaining results fall into two groups: Kristian’s original slow launch, with almost 4.4 seconds taken checking frameworks, all of them being recorded as cache misses, and the three VM tests. The latter were remarkable as launch time was uniform at just over 0.5 seconds, and a fifth of the time spent checking frameworks. That occurred because macOS proceeded to run the app before checking of frameworks was complete. In those three tests, no cache misses were recorded, and time was independent of whether a previous Gatekeeper assessment was used. Two of them even included brief local checks against the app’s notarization ticket.
Neither disabling SIP nor disabling Gatekeeper had any effect on the time taken to check frameworks, nor on the total time taken to launch the app.
Diagnosing slow launches
I have given details of my results because, if there’s one thing they demonstrate, it’s the complexity of determining app launch times. In Pages, much of the delay seems to result from cache misses slowing framework checks, and disabling SIP restored rapid launching, as Jeff Johnson reported. In Calibre, launches proceed without waiting for framework checks to complete, and disabling SIP doesn’t result in any acceleration.
This reflects the complexity of app launch. I’ve here concentrated on security checks, as they have been most commonly blamed for this problem. Other processes that have to be completed during launch include:
LaunchServices registration and coordination
RunningBoard registration and resource management
TCC privacy controls
sandbox and container preparation
iCloud connection
checks for app updates
all other app initialisations
several of which can involve their own security checks.
Although most of those are well recorded in log entries, disentangling them when watching Activity Monitor or in spindumps is more demanding, and there’s ample opportunity to gain false impressions.
But none of these tests or logs represent what happens in the slowest of launches that can take several minutes. Even the 8 seconds total launch time taken on Calibre’s first run pales in comparison to the 300 seconds that some report. There’s a difference of two orders of magnitude, suggesting that really long launch times are different from all the observations and measurements here. There must be something seriously wrong for an app to take several minutes to launch. Investigating that is also a great challenge.
Tackling slow launching
Results above demonstrate how subtle factors can result in fairly modest apps launching in anything from less than 0.2 to almost 8 seconds. If an app regularly takes several seconds to launch, and that irks you, try pre-warming it first. Longer times are more likely to occur after a Mac has been started up from cold, and apps usually launch fastest when they’ve already been run in the same session. Even if your Mac doesn’t have sufficient memory to leave that app running, that could make subsequent launches quicker.
If an app not infrequently takes more than 30 seconds to launch, then finding the cause becomes more important, and if it takes several minutes, you really need to investigate further.
Capturing an excerpt of the whole log for several minutes isn’t going to help, but will just overwhelm you with many MB of inscrutable data. If you know your way around spindumps, you may find them helpful, although they too can only cover brief periods of time. There are some basic steps you can take that can also help you diagnose and address performance problems more generally:
Measure launch time carefully and record it. Counting icon bounces in the Dock is better than nothing, and gives you an objective measure of time to launch.
Try in Safe mode. That disables most customising software, and any improvement in launch times points the finger at extensions, startup items and other software you have installed.
Create a new user and see if that account has the same problems. This can detect user-specific customisations that might be the cause.
Build an external bootable SSD with a ‘clean’ system, install the app(s) there, start up from it, and see whether it still launches as slowly. You can also try this using a more recent version of macOS, to see whether that helps.
The best way to preserve a record of what happened during a slow launch is to wait until the app is running properly, then perform a sysdiagnose, as that saves much of the log in a logarchive. You can initiate that in the Options … popup menu in Activity Monitor, or by pressing Command-Option-Control Shift-. (period or full stop). That logarchive can be browsed using Ulbow or even Console, but not (yet) LogUI.
I’m also keen to look at log records from one of these much slower launches. If you’re interested in cooperating, please comment below or send me an email (see the About page).


