Is high resolution time available in the log?
Earlier this week I looked at nanosecond timing in the macOS log, and showed some surprising results suggesting that macOS only writes log entries approximately every microsecond (954 nanoseconds). This article considers this in more detail, and demonstrates that’s an artefact, and that entries are written more frequently, and with greater precision in time. The problem is thus gaining access to high resolution time information in the macOS log.
There are currently two methods for third-party apps to read the contents of the ‘unified’ log in macOS, either using the log show command tool, or directly accessing entries through the OSLog API. When using the former, you can opt for entries to be supplied as an array of JSON dictionaries including the machTimestamp field, containing a number representing the Mach Absolute Time (MAT) since an arbitrary starting time. That doesn’t appear to be available in the OSLogEntry types returned using the OSLog API, which has to suffice with a Date value, although as that’s largely undocumented, that might be possible.
LogUI uses the OSLog API, whereas my older utility Ulbow uses log show instead, so giving it access to MAT fields that LogUI can’t obtain. I therefore compared two series of log entries written by blowhole, using both MAT fields from Ulbow, and LogUI’s estimates of nanosecond times obtained as I described previously.
Because MAT fields are relative to an arbitrary starting time, they can’t readily be converted to clock times, and need to be scaled using the appropriate timebase numerator (125 on Apple silicon) and denominator (3 on Apple silicon) to convert them from ‘ticks’ to nanoseconds. Scaling isn’t needed on Intel Macs, where each tick is one nanosecond.
Tests
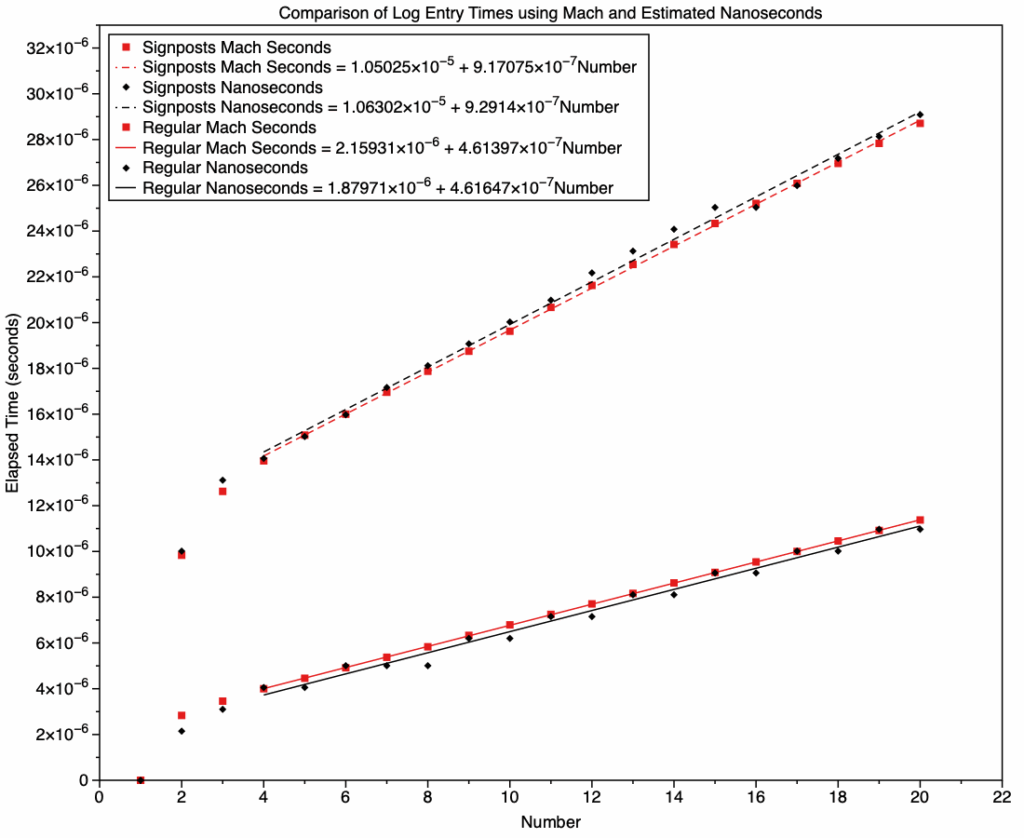
Two series of log entries were used for comparison, one consisting of 20 signposts written in rapid succession, the other of 20 regular log entries written rapidly, both on a Mac mini M4 Pro. Results are summarised in the graph below.
This graph shows elapsed time on its vertical axis against loop number in each series (1-20). The upper pair of regression lines (broken lines) are fitted to results from writing signposts, and the lower pair (solid lines) to results from writing regular log entries. In each pair, red lines and points are taken from Ulbow’s MAT data converted to elapsed times in nanoseconds. Black lines and points are taken from LogUI’s estimates of nanoseconds obtained from the Date value in OSLogEntry. Regressions start at the fourth point in each set of data, to allow for their initial non-linearity.
The one line common between this graph and that in the previous article is that for regular log entries based on LogUI’s nanoseconds, the unbroken black line at the bottom. This has a similar gradient of 4.62 x 10^-7 as previously at 4.58 x 10^-7, and its points are stepped as shown previously. In this series, 6-8 form a triplet and other points are paired. The equivalent based on MAT isn’t stepped, and each time is different, with an almost identical gradient of 4.61 x 10^-7.
This suggests the steps seen in LogUI’s nanosecond times are artefact, and don’t represent real times accurately.
Surprisingly, signposts were significantly slower than regular log entries, with a gradient similar to that of the iMac Pro shown in the previous tests, and slightly more than twice as slow as regular log entries on the M4 Pro. There’s only one stepped pair, 15-16, as each signpost loop took approximately 1 μs to complete. Gradients are similar, at 9.2 x 10^-7 and 9.3 x 10^-7.
Boot log analysis
Although I’m disappointed that estimates of time in nanoseconds given by this latest version of LogUI appear to be little more than artefact, at the same time those results don’t make a compelling case for such high resolution time in the log. With only 2-3 entries sharing the same time during a test intended to write log entries as quickly as possible, as long as their order is preserved, not having nanosecond resolution doesn’t appear important.
One of the busiest times for the log is during booting, when hundreds of thousands of entries are written over a period of just a second or two. I therefore examined the opening seconds of kernel boot in a VM, looking for timesteps containing multiple entries that would separate using higher resolution time. Several passages of 20-30 entries were found, but the longest by far was a sequence of 79 entries over a period of 12,875 nanoseconds, at an average of 163 ns per entry, a rate of over 6.1 million log entries per second. Its largest timestep had 9 entries written at exactly the same time in microseconds.
Conclusions
Log entries are written with times that resolve to nanoseconds, not 1 microsecond.
Current estimates of nanosecond times in LogUI are largely artefact resulting from the poor time resolution of OSLogEntry data.
A high resolution substitute is only available using log show, and even then only allows calculation of time differences, rather than actual times.
Resolving time to nanoseconds is important when analysing particularly busy periods in the log, when entries can be written at an average of one per 160 nanoseconds, over six million entries per second.

