Inside M4 chips: P cores hosting a VM

One common but atypical situation for any M-series chip is running a macOS virtual machine. This article explores how virtual CPU cores are handled on physical cores of an M4 Pro host, and provides further insight into their management, and thread mobility across P core clusters.
Unless otherwise stated, all results here are obtained from a macOS 15.1 Sequoia VM in my free virtualiser Viable, with that VM allocated 5 virtual cores and 16 GB of memory, on a Mac mini M4 Pro running macOS Sequoia 15.1 with 48 GB of memory, 10 P and 4 E cores.
How virtual cores are allocated
All virtualised threads are treated by the host as if they are running at high Quality of Service (QoS), so are preferentially allocated to P cores, even though their original thread may be running at the lowest QoS. This has the side-effect of running virtual background processes considerably quicker than real background threads on the host.
In this case, the VM was given 5 virtual cores so they could all run in a single P cluster on the host. That doesn’t assign 5 physical cores to the VM, but runs VM threads up to a total of 500% active residency across all the P cores in the host. If the VM is assigned more virtual cores than are available in the host’s P cores, then some of its threads will spill over and be run on host E cores, but at the high frequency typical of host threads with high QoS.
Performance
There is a slight performance hit in virtualisation, but it’s surprisingly small compared to other virtualisers. Geekbench 6.3.0 benchmarks for guest and host were:
CPU single core VM 3,643, host 3,892
CPU multi-core VM 12,454, host 22,706
GPU Metal VM 102,282, host 110,960, with the VM as an Apple Paravirtual device.
Some tests are even closer: using my in-core floating point test, 1,000 Mloops run in the VM in 4.7 seconds, and in the host in 4.68 seconds.
Host core allocation
To assess P core allocation on the host, an in-core floating point test was run in the VM. This consisted of 5 threads with sufficient loops to fully occupy the virtual cores for about 20 seconds. In the following charts, I show results from just the first 15 seconds, as representative of the whole.
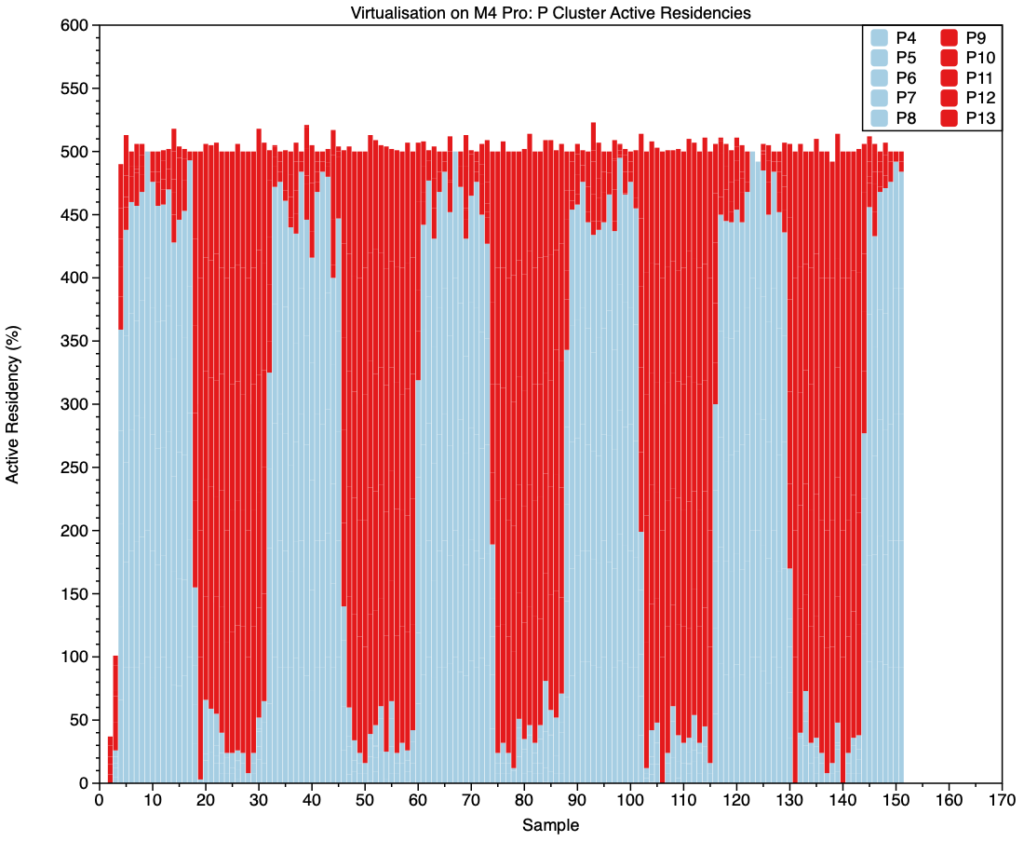
When viewed by cluster, those threads were mainly loaded first onto the first P cluster (pale blue bars), where they ran for just over 1 second before being moved to the second cluster (red bars). They were then regularly switched between the two P clusters every few seconds throughout the test. Four cycles were completed in this section of the results, with each taking 2.825 seconds, so threads were switched between clusters every 1.4 seconds, the same time as I found when running threads on the host alone, as reported previously.
For most of the 15 seconds shown here, total active residency across both P clusters was pegged at 500%, as allocated to the VM in its 5 virtual cores, with small bursts exceeding that. Thus that 500% represents those virtual cores, and the small bursts are threads from the host. Although the great majority of that 500% was run on the active P cluster, a total of about 30% active residency consisted of other threads from the VM, and ran on the less active P cluster. That probably represents the VM’s macOS background processes and overhead from its folder sharing, networking, and other Virtio device use.
When broken down to individual cores within each cluster, seen in the first above and the second below, total activity differs little across the cores in the active cluster. During its period in the active cluster, each core had an active residency of 80-100%, bringing the cluster total to about 450% while most active.
In case you’re wondering whether this occurs on older Apple silicon, and it’s just a feature of macOS Sequoia, here’s a similar example of a 4-core VM running 3 floating point threads in an M1 Max with macOS 15.1, seen in Activity Monitor’s CPU History window. There’s no movement of threads between clusters.
P core frequencies
powermetrics, used to obtain this data, provides two types of core frequency information. For each cluster it gives a hardware active frequency, then for each core it gives an individual frequency, which often differs within each cluster. Cores in the active P cluster were typically reported as running at a frequency of 4512 MHz, although the cluster frequency was lower, at about 3858 MHz. For simplicity, cluster frequencies are used here.
This chart shows reported frequencies for the two P clusters in the upper lines. Below them are total cluster active residencies to show which cluster was active during each period.
The active cluster had a steady frequency of just below 3,900 MHz, but when it became the less active one, its frequency varied greatly, from idle at 1,260 MHz up to almost 4,400 MHz, often for very brief periods. This is consistent with the active cluster running the intensive in-core test threads, and the other cluster handling other threads from both the VM and host.
CPU power
Several who have run VMs on notebooks report that they appear to drain the battery quickly. Using the previous results from the host, the floating point test used here would be expected to use a steady 7,000 mW.
This last chart shows the total CPU power use in mW over the same period, again with cluster active residency (here multiplied by 10), added to aid recognition of cluster cycles. This appears to average about 7,500 mW, only 500 mW more than expected when run on the host alone. That shouldn’t result in a noticeable increase in power usage in a notebook.
In the previous article, I remarked on how power used appeared to differ between the two clusters, and this is also reflected in these results. When the second cluster (P1) is active, power use is less, at about 7,100 mW, and it’s higher at about 7,700 when the first cluster (P0) is active. This needs to be confirmed on other M4 Pro chips before it can be interpreted.
Key information
macOS guests perform almost as well as the M4 Pro host, although multi-core benchmarks are proportionate to the number of virtual cores allocated to them. In particular, Metal GPU performance is excellent.
All threads in a VM are run as if at high QoS, thus preferentially on host P cores. This accelerates low QoS background threads running in the VM.
Virtual core allocation includes all VM overhead from the VM, such as its macOS background threads.
Guest threads are as mobile as those of the host, and are moved between P clusters every 1.4 seconds.
Although threads run in a VM incur a small penalty in additional power use, this shouldn’t be significant for most purposes.
Once again, evidence suggests that the first P cluster (P0) in an M4 Pro uses slightly more power than the second (P1). This needs to be confirmed in other systems.
powermetrics can’t be used in a VM, not unsurprisingly.
Previous article
Explainer
Residency is the percentage of time a core is in a specific state. Idle residency is thus the percentage of time that core is idle and not processing instructions. Active residency is the percentage of time it isn’t idle, but is actively processing instructions. Down residency is the percentage of time the core is shut down. All these are independent of the core’s frequency or clock speed.


