Tune for Performance: Activity Monitor’s CPU view

Activity Monitor is one of the unsung heroes of macOS. If you understand how to interpret its rich streams of measurements, it’s thoroughly reliable and has few vices. When tuning for performance, it should be your starting point, a first resort before you dig deeper with more specialist tools such as Xcode’s Instruments or powermetrics.
How Activity Monitor works
Like Xcode’s Instruments and powermetrics, the CPU view samples CPU and GPU activity over brief periods of time, displays results for the last sampling period, and updates those every 1-5 seconds. You can change the sampling period used in the Update Frequency section of the View menu, and that should normally be set to Very Often, for a period of 1 second.
This was normally adequate for many purposes with older M-series chips, but thread mobility in M4 chips can be expected to move threads from core to core, and between whole clusters, at a frequency similar to available sampling periods, and that loses detail as to what’s going on in cores and clusters, and can sometimes give the false impression that a single thread is running simultaneously on multiple cores.
However, sampling frequency also determines how much % CPU is taken by Activity Monitor itself. While periods of 0.1 second and less are feasible with powermetrics, in Activity Monitor they would start to effect its results. If you need to see finer details, then you’ll need to use Xcode Instruments or powermetrics instead.
% CPU
Central to the CPU view, and its use in tuning for performance, is what Activity Monitor refers to as % CPU, which it defines as the “percentage of CPU capability that’s being used by processes”. As far as I can tell, this is essentially the same as active residency in powermetrics, and it’s vital to understand its strengths and shortcomings.
Take a CPU core that’s running at 1 GHz. Every second it ‘ticks’ forward one billion times. If an instruction were to take just one clock cycle, then it could execute a billion of those every second. In any given second, that core is likely to spend some time idle and not executing any instructions. If it were to execute half a billion instructions in any given second, and spend the other half of the time idle, then it has an idle residency of 50% and an active residency of 50%, and that would be represented by Activity Monitor as 50% CPU. So a CPU core that’s fully occupied executing instructions, and doesn’t idle at all, has an active residency of 100%.
To arrive at the % CPU figures shown in Activity Monitor, the active residency of all the CPU cores is added together. If your Mac has four P and four E cores and they’re all fully occupied with 100% active residency each, then the total % CPU shown will be 800%.
There are two situations where this can be misleading if you’re not careful. Intel CPUs feature Hyper-threading, where each physical core acquires a second, virtual core that can also run at another 100% active residency. In the CPU History window those are shown as even-numbered cores, and in % CPU they double the total percentage. So an 8-core Intel CPU then has a total of 16 cores, and can reach 1600% when running flat out with Hyper-threading.
The other situation affects Apple silicon chips, as their CPU cores can be run at a wide range of different frequencies according to control by macOS. However, Activity Monitor makes no allowance for their frequency. When it shows a core or total % CPU, that could be running at a frequency as low as 600 MHz in the M1, or as high as 4,512 MHz in the M4, nine times as fast. Totalling these percentages also makes no allowance for the different processing capacity of P and E cores.
Thus an M4 chip’s CPU cores could show a total of 400% CPU when all four E cores are running at 1,020 MHz with 100% active residency, or when four of its P cores are running at 4,512 MHz with 100% active residency. Yet the P cores would have an effective throughput of as much as six times that of the E cores. Interpreting % CPU isn’t straightforward, as nowhere does Activity Monitor provide core frequency data.
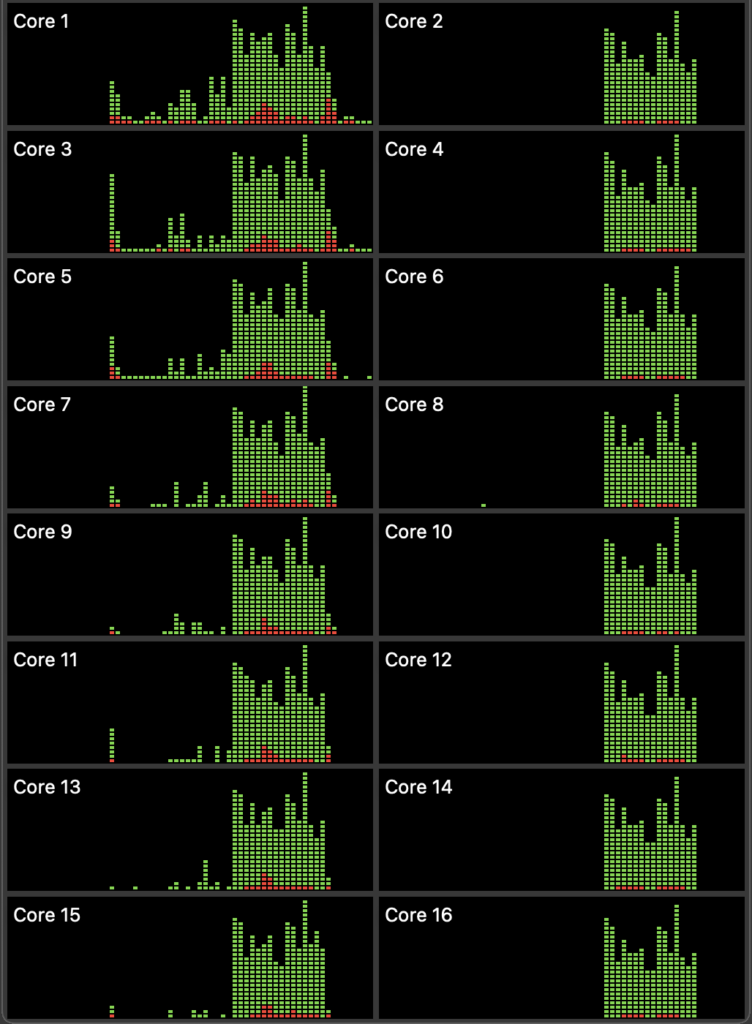
In this example from an M4 Pro, the left of each trace shows the final few seconds of four test threads running on the E cores, which took 99 seconds to complete at a frequency of around 1,020 MHz, then in the right exactly the same four test threads completed in 23 seconds on P cores running at nearer 4,000 MHz. Note how lightly loaded the P cores appear, although they’re executing the same code at almost four times the speed.
Threads and more
For most work, you should display all the relevant columns in the CPU view, including Threads and GPU.
Threads are particularly important for processes to be able run on multiple cores simultaneously, as they’re fairly self-contained packages of executable code that macOS can allocate to a core to run. Processes that consist of just a single thread may get shuffled around between different cores, but can’t run on more than one of them at a time.
Another limitation of Activity Monitor is that it can’t tell you which threads are running on each core, or even which type of core they’re running on. When there are no other substantial threads active, you can usually guess which threads are running where by looking in the CPU History window, but when there are many active threads on both E and P cores, you can’t tell which process owns them.
You can increase your chances of being able to identify which cores are running which threads by minimising all other activity, quitting all other open apps, and waiting until routine background activities such as Spotlight have gone quiet. But that in itself can limit what you can assess using Activity Monitor. Once again, Xcode Instruments and powermetrics can make such distinctions, but can easily swamp you with details.
GPU and co-processors
Percentages given for the GPU appear to be based on a similar concept of active residency without making any allowance for frequency. As less is known about control of GPU cores, that too must be treated carefully.
Currently, Activity Monitor provides no information on the neural processing unit (ANE), or the matrix co-processor (AMX) believed to be present in Apple silicon chips, and that available using other tools is also severely limited. For example, powermetrics can provide power use for the ANE, but doesn’t even recognise the existence of the AMX.
Setting up
In almost all cases, you should set the CPU view to display All processes using the View menu. Occasionally, it’s useful to view processes hierarchically, another setting available there.
Extras
Activity Monitor provides some valuable extras in its toolbar. Select a process and the System diagnostics options tool (with an ellipsis … inside a circle) can sample that process every millisecond to provide a call graph and details of binary images. The same menu offers to run a spindump, for investigating processes that are struggling, and to run sysdiagnose and Spotlight diagnostic collections. The Inspect selected process tool ⓘ provides information on memory, open files and ports, and more.
Explainers
Residency is the percentage of time a core is in a specific state. Idle residency is thus the percentage of time that core is idle and not processing instructions. Active residency is the percentage of time it isn’t idle, but is actively processing instructions. Down residency is the percentage of time the core is shut down. All these are independent of the core’s frequency or clock speed.
When an app is run, there’s a single runtime instance created from its single executable code. This is given its own virtual memory and access to system resources that it needs. This is a process, and listed as a separate entity in Activity Monitor.
Each process has a main thread, a single flow of code execution, and may create additional threads, perhaps to run in the background. Threads don’t get their own virtual memory, but share that allocated to the process. They do, though, have their own stack. On Apple silicon Macs they’re easy to tell apart as they can only run on a single core, although they may be moved between cores, sometimes rapidly. In macOS, threads are assigned a Quality of Service (QoS) that determines how and where macOS runs them. Normally the process’s main thread is assigned a high QoS, and background threads that it creates may be given the same or lower QoS, as determined by the developer.
Within each thread are individual tasks, each a quantity of work to be performed. These can be brief sections of code and are more interdependent than threads. They’re often divided into synchronous and asynchronous tasks, depending on whether they need to be run as part of a strict sequence. Because they’re all running within a common thread, they don’t have individual QoS although they can have priorities.

