M4 Pro full on: when CPU and GPU draw over 50 W, and how Low Power mode changes that

Most testing and benchmarks avoid putting heavy loads on CPU and GPU at the same time, so running an Apple silicon chip ‘full on’. This article explores what happens in the CPU and GPU of an M4 Pro when they’re drawing a total of over 50 W, and how that changes in Low Power mode. It concludes my investigations of power modes, for the time being.
Methods
Three test runs were performed on a Mac mini M4 Pro with 10 P and 4 E cores, and a 20-core GPU. In each run, Blender Benchmarks were run using Metal, and shortly after the start of the first of those, monster, 3 billion tight loops of NEON code were run on CPU cores at maximum Quality of Service in 10 threads. From previous separate runs, the monster test runs the GPU at its maximum frequency of 1,578 MHz and 100% active residency, to use about 20 W, and that NEON code runs all 10 P cores at high frequency of about 3,852 MHz and 100% active residency to use about 32 W. This combined testing was performed in each of the three power modes: Low Power, Automatic, and High Power.
In addition to recording test performance, powermetrics was run during the start of each NEON test at its shortest sampling period, with both cpu_power and gpu_power samplers active.
Performance
There was no difference in performance between High Power and Automatic settings, which completed both tasks with the same performance as when they were run separately:
NEON time separate 2.12 s, together High Power 2.12 s, Auto 2.12 s
monster performance separate 1215-1220, together High Power 1221, Auto 1220.
As expected, Low Power performance was greatly reduced. NEON time was 4.33 s (49% performance), even slower than running alone at Low Power (2.87 s), and monster performance 795, slightly lower than running alone at Low Power (837).
High Power mode
This first graph shows CPU core cluster frequencies and active residencies for a period of 0.3 seconds when the monster test was already running, and the NEON test was started.
At time 0, the P0 cluster (black) was shut down, and the P1 cluster (red) running with one core at 100% active residency, a second at about 60%, and at about 3,900 MHz. As the ten test threads were loaded onto the two clusters, cluster frequencies were quickly brought to 3,852 MHz, by reducing that of the P1 cluster and rapidly increasing that of the P0 cluster.
By 0.1 seconds, both clusters were at full active residency and running at 3,852 MHz, where they remained until the NEON test threads completed.
Power used by the CPU followed the same pattern, rising rapidly from about 6,000 mW to about 32,000 mW at 0.1 seconds. GPU power varied between 8,600-23,000 mW, resulting in a peak total power of slightly less than 52,000 mW, and a dip to 40,600 mW. Typical sustained power with both CPU and GPU tests running was 50-52 W.
Low Power mode
These results are more complicated, and involve significant use of the E cluster.
This graph shows active residency alone, and this time includes the E cluster, shown in blue, and the GPU, in purple. NEON test threads were initially loaded into the two P clusters, filling them at 0.13 seconds. After that, threads were moved from some of those P cores to run on E cores instead, leaving just two test threads running on each of the P clusters by 0.26 seconds. Over much of that time the GPU had full active residency, but as that fell threads were moved from E cores back to P cores. By the end of this period of 0.5 seconds, 4 of 5 cores in each of the two P clusters were at 100%, and the GPU was also at 100% active residency.
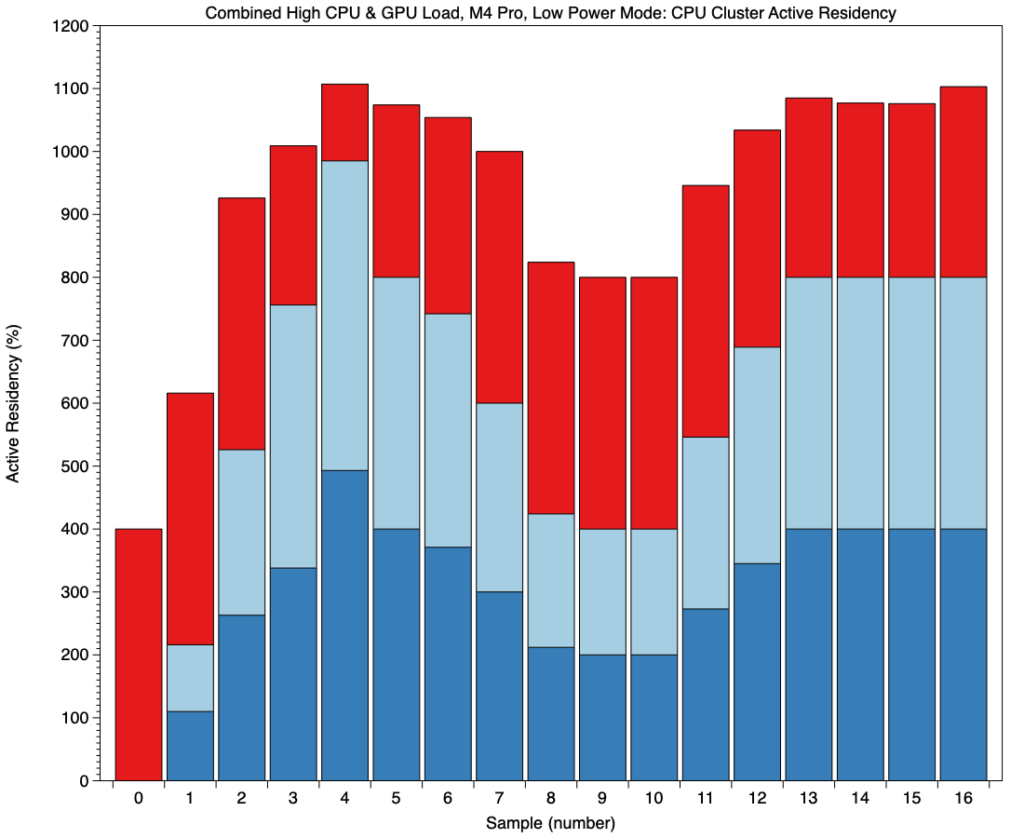
This bar chart shows changing cluster total active residency for the E (red) and two P (blues) clusters by sample. With 10 test threads and significant overhead, the total should have reached at least 1,000%, which was only achieved in sample 4, and from sample 13 onwards.
Those active residencies are shown in the lower section of this graph (with open circles), together with cluster frequencies (filled circles) above them. As the P clusters were being loaded with test threads, both P clusters (black) were brought to a frequency of only 1,800 MHz, compared with 3,852 MHz in the High Power test. The E cluster (blue) was run throughout at its maximum frequency of 2,592 MHz, except for one sample period. GPU frequency (purple) remained below 1,000 MHz throughout, compared with a steady maximum of 1,578 MHz when at High Power.
Power changed throughout this initial period running the NEON test. Initially, CPU power (red) rose to a peak of 6,660 mW, then fell slowly to 3,500 mW before rising again to about 6,000 mW. GPU power rose to peak at just over 7,000 mW, but at one stage fell to only 26 mW. Total power used by the CPU and GPU ranged between 11-13.2 W, apart from a short period when it fell below 5 W. Those are all far lower than the steadier power use in High Power mode.
How macOS limits power
Running these tests in Low Power mode elicited some of the most sophisticated controls I have seen in Apple silicon chips. Compared to being run unfettered in Automatic or High Power mode, macOS used a combination of strategies to keep CPU and GPU total power use below 13.5 W:
P core frequencies were limited to 1,800 MHz, instead of 3,852 MHz.
High QoS threads that would normally have been run on P cores were transferred to E cores, which were then run at their maximum frequency of 2,592 MHz.
Threads continued to be transferred between E and P cores to balance performance against power use.
GPU frequency was limited to below 1,000 MHz.
Despite reducing power use to a total of 25% of High Power mode, effects on performance were far less, attaining about 50% of that at High Power mode.
References
How Low Power mode controls CPU cores
Power Modes and Apple silicon CPUs
Last Week on My Mac: Power throttle
Inside M4 chips: CPU power, energy and mystery
Inside M4 chips: Matrix processing and Power Modes
Power Modes and Apple Silicon GPUs
Evaluating M3 Pro CPU cores: 1 General performance
Explainer
Residency is the percentage of time a core is in a specific state. Idle residency is thus the percentage of time that core is idle and not processing instructions. Active residency is the percentage of time it isn’t idle, but is actively processing instructions. Down residency is the percentage of time the core is shut down. All these are independent of the core’s frequency or clock speed.


