Can a different core allocation strategy work on Apple silicon?
One of the most characteristic features of the behaviour of Apple silicon chips is the way that threads are allocated by cluster. This is because their CPU cores are built into clusters, with each core sharing L2 cache and running at the same frequency as others in that cluster. It’s easy to see this by loading the CPU with different numbers of threads, each assigned a high Quality of Service (QoS) so that macOS tries to run them on Performance (P) cores when they’re available.
This diagram shows how threads are allocated to the cores of the first P cluster in an M1 Max CPU, until it’s fully loaded with four cores each running one thread. Only when a fifth thread is added does macOS allocate that to a core within the second P cluster, which it then fills until there are four threads running in each of its two P clusters. Note also how those threads, with their high QoS, are run on P cores so long as they’re available, leaving the Efficiency (E) cores to run background threads uninterrupted.
There appear to be remarkably few exceptions to this thread allocation strategy. This article describes one, suggests why this should be an exception, and considers whether its different pattern of core use delivers optimal performance.
The observation that led to this study was that, when running one particular core performance test, in many cases the last thread to complete always did so significantly later than all the previous threads. For example, when testing with three threads, their times to complete might read, in seconds, 2.03, 2.03, 3.42. Run four, though, and the third thread completes as fast as the first two, and again it’s the last thread that comes in about 1.4 seconds after the others: 2.02, 2.04, 2.04, 3.40.
Methods
To discover what was going on, I loaded three different Macs with these chunky test threads using my GUI wrapper app AsmAttic. The source code for the vDSP_mmul test is given in the Appendix at the end of this article. After setting up two dense 16 x 16 32-bit floating point matrices, the repeated loop calls a function to multiply them using vDSP_mmul() from Apple’s Accelerate library. Other than incrementing a 32-bit floating point loop counter, that’s all the code repeats. Each thread used in testing consisted of 10 million of those loops, and was given a QoS of 33, which normally ensures the thread is run on a P core so long as one is available. Performance metrics were measured in samples of 0.1 seconds duration over a period of at least 5 seconds using powermetrics.
Macs used in this test included a 16-inch MacBook Pro with an M1 Pro chip (8P + 2E), a Mac Studio with an M1 Max chip (8P + 2E), and a 16-inch MacBook Pro with an M3 Pro chip (6P + 6E). All were running macOS 14.2 or 14.2.1. Tests were performed at times when there were no other processes making significant use of the CPU cores, and in a way that caused minimum extraneous activity on the cores. Typically, this resulted in tests being run with initial conditions of P cores idling at 600 MHz frequency and 0% active residency, and E cores at less than 1200 MHz and 20% active residency.
Core use pattern
When running vDSP_mmul() threads, but not with any other test, M1 Pro and Max chips, but not the M3 Pro, allocated their CPU cores in a completely different order, summarised in the diagram below.
Differences are obvious from two threads upwards, in that the second thread isn’t allocated to a second core in the first P cluster, but one in the second P cluster. Although being run at high QoS, the third thread is then allocated to the E cluster, and moved between its two cores. With 3-5 threads being run in total, the total active residency given to that thread is about 100% across the two E cores. With 6 and more threads, both E cores have active residencies of 100% and are running at a frequency of over 2000 MHz.
Core allocation is thus made to balance the load across the three clusters, with similar numbers of P cores running threads in each of the two clusters. Because these high QoS threads are also allocated to E cores, P cores are deliberately under-allocated. Although all 8 threads could have been run on P cores alone, because 2 of the threads are run on the E cores, there are 2 P cores sitting idle. macOS has chosen not to make most use of P cores when running high QoS threads, an exceptional allocation strategy.
Three threads, three clusters
To understand exactly what’s going on, I looked in further detail at the results of running just 3 threads, the lowest number at which this allocation strategy becomes so distinct, and in which the last thread to complete takes so long.
Cluster frequencies are much as would be expected. All three clusters quickly run up to high frequency as the threads are loaded. P cores are run at 2900 MHz while they’re processing threads, then drop to idle frequency once they’re completed. E cores are run at over 2000 MHz when processing the single thread allocated to them, then fall to more typical low-load frequencies around 1000 MHz.
Total CPU power follows a similar pattern, peaking at more than 8500 mW when all three clusters are fully active, and dropping to 4000 mW when only a single P core is still processing a test thread.
Active residency of the two cores in the E cluster totals 110-120% over the period that they’re running at high frequency and processing their single test thread. Share of that transfers quite often between the two cores, and once that period ends, they drop back to totals of 20-30%. (Active residency is the percentage of time that each core isn’t idle, but actively processing instructions, and ranges from 0% when fully idle, to 100% when fully active, for each core.)
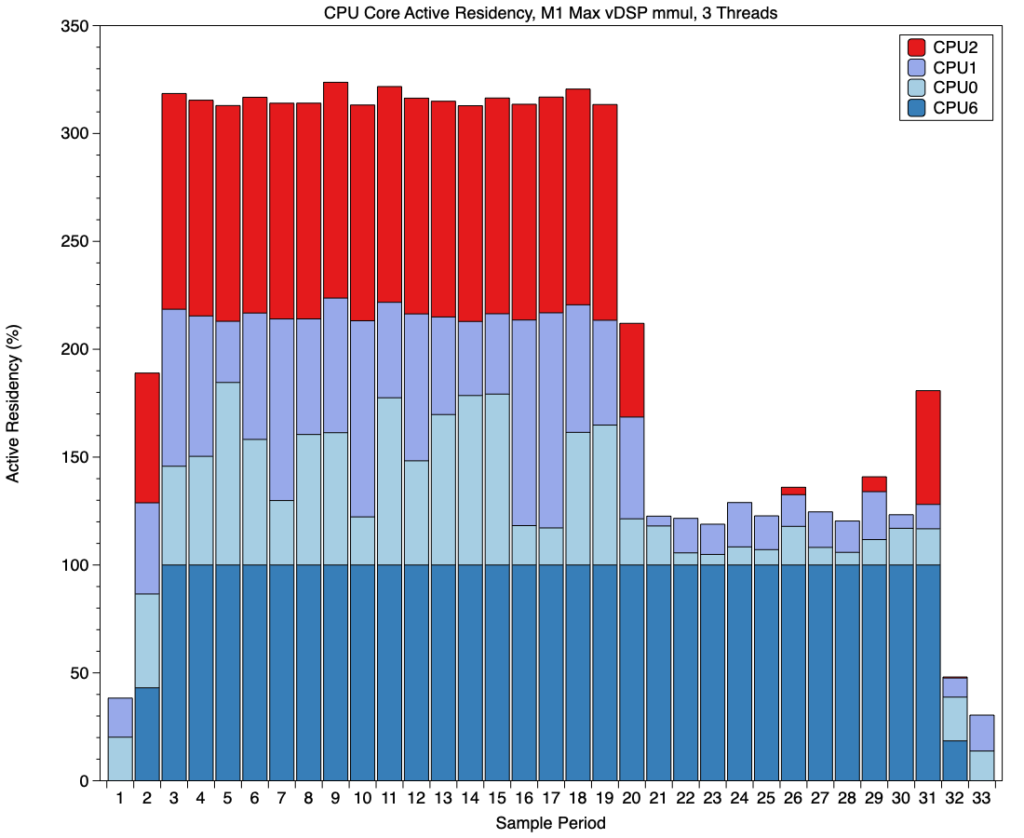
This chart shows active residency for all four cores in the first P cluster, and demonstrates well how almost all of the processing is performed on a single core, here CPU2, during the period that this cluster was processing the thread allocated to it. There’s also a small burst of activity at the end, probably when performance results are calculated and displayed in the app.
Active residency on the second P cluster was far simpler: a single core, here CPU6, ran up to 100% at the start of the test, and remained at that until the end.
Pooling the active residency measurements for the four active cores shows a pattern matching that of their frequencies, with an initial period during which total active residency exceeded 300% (100% for each of the three threads), then fell to leave just one P core at 100% and low-level background activity on the E cores. That can be summarised in the diagram below.
Correlating those with the thread performance times recorded, it’s clear that the two P cores ran the first two threads to complete as shown in red, and the third thread started execution on the E cores then was transferred to CPU8, in the second P cluster, once that core had completed its own thread. About 1.4 seconds later, that thread finally completed execution.
Delayed completion of the last thread
Examining results from a dozen repetitions of the same test using three threads shows that, while different cores were used in test runs, the pattern of cluster use was consistent in every repetition. As each thread run in tests is numbered, it’s also clear that the last thread to complete varied between tests, and often wasn’t the third thread to be created by the app. However, one of the three threads always completed about 1.4 seconds after the other two.
As test performance times provide, for tests consisting of 3-8 threads, the time taken for each thread run only on a P core, it’s straightforward to estimate the proportion of each thread completed on both E and P cores. For 3-5 threads, where only the last thread was slow to complete, 67-69% of that slow thread was executed on the P core at the end, and 31-33% on the E cores. For 6-8 threads, those were 55-58% and 42-45% respectively.
The first of those is in keeping with general performance found on M1 cores, that at their best E cores process threads at around 30% of the speed of P cores; the second reflects the enhanced performance when the two-core E cluster in the M1 Pro/Max CPU is run at higher frequency. These results are therefore entirely consistent with the thread allocation pattern proposed in the diagram above.
Why balance core use between clusters?
The only reason that I can suggest to account for this distinctive cluster-balancing strategy is that each cluster requires access to its own performance-limiting resource. The only resources that are known to be shared within each cluster are L2 cache and the undocumented AMX matrix co-processor.
Evidence that the vDSP_mmul function uses the AMX is provided by the power use given by powermetrics. When running just two threads on P cores, and with a third on the E cores, power consumption was sustained at over 8.5 W for the CPU, with no ANE or GPU power use at all. I have previously measured sustained total power consumption for running two core-intensive NEON threads on M1 Pro/Max P cores at just over 4.5 W, with the P cores running at a higher frequency of 3132 MHz compared with vDSP_mmul running at 2900 MHz. I don’t know of any way to account for an additional 4 W on the CPU cores alone, when running just two threads on its P cores.
Is this pattern optimal?
Currently, if you run four test threads on an M1 Pro/Max, the first three of those complete in around 2.03 seconds, even though two of those threads will have been run on cores within the same P cluster. Yet when macOS runs one core less, it chooses to allocate one of the three threads to the E cores, where it runs at around a third of the speed. So when the two threads have finished on the P cores, that slower thread is moved from an E to a P core, to complete the remaining 70%. For three threads of identical code, performing the same number of loops, using the cores in this way can never perform as well as allocating them to P cores alone, until they are all fully occupied. Therefore, in this particular case, the core allocation strategy used is sub-optimal.
This would be different if the shared resource, such as an AMX co-processor, performed significantly better when being accessed by just one thread at a time, but there’s no evidence here that is currently a limiting factor. That may have resulted from improvements in the shared resource, or in access to it from multiple threads. It also wouldn’t apply if the three threads were unequal in their computational requirements, and that allocated to the E cores could be completed there before those running on the P cores, nor with different QoS assigned to each of the threads.
The overall effect in these test conditions is therefore to extend the time taken to complete all the threads by nearly 70%, a substantial amount. But this only appears to apply to the vDSP_mmul function when run on M1 Pro and Max chips. Other matrix tests that I suspect are also run on the AMX don’t behave in this way, and this doesn’t appear to apply to the M3 Pro either. As I’m unable to test other M1 models, M2 models, or the M3 Max, I don’t know whether this strategy is used on those, nor whether it might have an adverse impact on their performance.
Conclusions
The standard core allocation strategy to employ cores by cluster and to run high QoS threads preferentially on P cores isn’t universal.
When used on M1 Pro and Max CPUs, at least, a different strategy may be used, to balance the number of cores used in each cluster, including E cores, even though the threads have high QoS and some P cores remain unused.
Adopting that balancing strategy may, in the right circumstances, result in sub-optimal performance, extending time required for thread completion by up to 70%.
This may have resulted from earlier limitations in access to or performance of the AMX co-processor, but no longer appears to apply.
macOS may employ different core allocation strategies for specific purposes, and code should never make assumptions as to the strategy to be used.
Appendix: Source code
var theCount: Float = 0.0
let A = [Float](repeating: 1.234, count: 256)
let IA: vDSP_Stride = 1
let B = [Float](repeating: 1.234, count: 256)
let IB: vDSP_Stride = 1
var C = [Float](repeating: 0.0, count: 256)
let IC: vDSP_Stride = 1
let M: vDSP_Length = 16
let N: vDSP_Length = 16
let P: vDSP_Length = 16
A.withUnsafeBufferPointer { Aptr in
B.withUnsafeBufferPointer { Bptr in
C.withUnsafeMutableBufferPointer { Cptr in
for _ in 1…theReps {
vDSP_mmul(Aptr.baseAddress!, IA, Bptr.baseAddress!, IB, Cptr.baseAddress!, IC, M, N, P)
theCount += 1
} } } }
return theCount
Apple describes vDSP_mmul() as performing “an out-of-place multiplication of two matrices; single precision.” “This function multiplies an M-by-P matrix A by a P-by-N matrix B and stores the results in an M-by-N matrix C.”