Writing a third-generation log browser using SwiftUI: 3 Lost memory
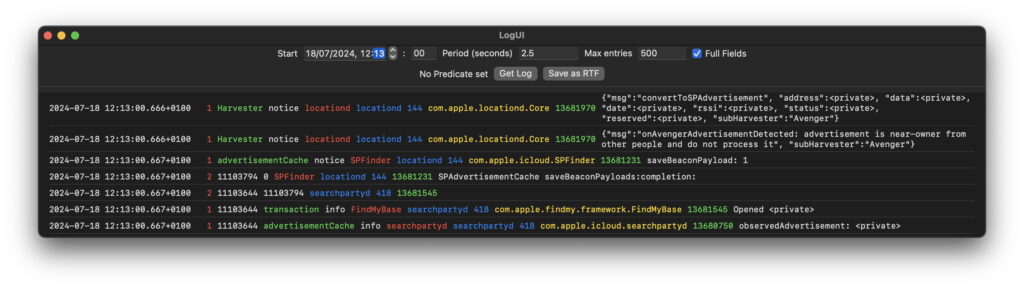
With a working demo of what I hope will form the basis of a third-generation log browser, it was time to turn that into something useful. My next step with LogUI was to equip it with controls to browse excerpts of any section of the active log on your Mac. In particular, this means setting a time in the past, a period over which to collect and display log entries in its SwiftUI List view, and writing them out to a Rich Text file.
This uses a SwiftUI DatePicker to set the date and time of the start of the excerpt, which I’ll consider in detail on Sunday, adds an option to display just a selection of the fields, buttons to get the log extract and to save it to RTF, and moves all the other settings apart from the predicate into the top of the window. It’s already starting to look more like Ulbow.
Time and memory
As I realised in my initial explorations of the OSLog API in macOS, there are only three ways of specifying the starting point of any log extract: relative to the last boot, relative to the latest log entry (thus ‘now’), or at an arbitrary time point between the start and end of the log. There’s no way to specify an end point, and when working forward through the log, that defaults to the latest log entry, which could be days later. Thus, to collect entries between two arbitrary points, you can only specify the start, and stop collecting entries once their timestamp is more recent than the end point. As I pointed out in my initial assessment of using OSLog, you also need to keep a running total of entries, lest they overwhelm the app by the million.
Once I had developed LogUI to collect entries for set time periods after an arbitrary starting point in the past, I used that to estimate the amount of memory required for sample collections of all log entries over a period of one second, for which I also set a maximum of 2,000 entries. When collected in the very recent past, just a few seconds before the latest log entry, that amounted to an average of 30 MB, but from an hour earlier it rose alarmingly to 176 MB.
Using a predicate to restrict the entries collected was highly effective: in one test, using a predicate to include only entries from XProtect Remediator as an example, a 24 hour extract required only 40 MB. Although that might appear impressive in comparison with the results above, my current XProCheck, relying on log show rather than OSLog, uses just over 35 MB total memory to display four full days of log extracts.
With the existing OSLog API, it thus appears that only two use cases work well:
all log entries for periods of a few seconds in the very recent past, or
a narrow group of log entries, filtered using a suitable predicate, for periods up to many hours.
Even imposing a tight limit on the total number of log entries to be displayed, capturing all log entries just a few minutes into the past results in excessive memory use. In this respect, my original method using the log show command is far superior, as that imposes no memory overhead for extracts obtained from any time in the past, and doesn’t require narrow predicate filtering to control the memory it requires.
Memory not released
Memory limitations of using OSLog are compounded by the observation that the memory that it uses isn’t freed after use. Indeed, it isn’t even released when all the app’s windows are closed. This functions as a memory leak, and my more capable test app quickly consumed more than 1 GB of memory, after starting at only 16.9 MB before obtaining any log extracts.
To assess this further, I used the Memory Leaks feature in Xcode Instruments. Although that surprisingly failed to warn of any memory leak, the chart below shows a typical result.
For this test, I opened four windows and left them without log extracts. I set each to capture and display a different log extract of 1.0 seconds duration, or a maximum of 500 entries, from about an hour earlier. I then fetched the log extract for each window in quick succession. Each extract resulted in memory allocation by OSLog of more than 210 MB, rising in steps until the app was using just over 1 GB in total.
I then closed each window in turn, releasing just a few MB each time, to a final memory use of just under 1 GB without any open windows. Leaving the app in that state for an hour didn’t result in any further reduction in its memory use, which was only released when the app was quit.
I therefore believe that memory used by the logging system in OSLog isn’t currently being released after use, and will shortly be reporting this to Apple in Feedback.
Conclusions
OSLog needs an additional means of setting a time window for log collections.
Currently, OSLog only supports a narrow range of use cases.
The log show command remains far superior to OSLog in its capabilities and resource use.
The logging system fails to release memory correctly, resulting in a memory leak that severely limits its usefulness.
Nearly five years after its introduction, OSLog is still not suitable as a replacement for log show.
As a result, I have put this project on hold pending solutions to these problems. Ulbow already performs better than LogUI ever could.
Previous articles
Writing a third-generation log browser using SwiftUI: 1 Getting log entries
Writing a third-generation log browser using SwiftUI: 2 Displaying log entries